Node metrics on master: where the numbers disagree
rancher/dashboard issue 16247 · master preview (built after PR 18858) · cluster created-dashboard-2 · 2026-11-02
How these screenshots were taken
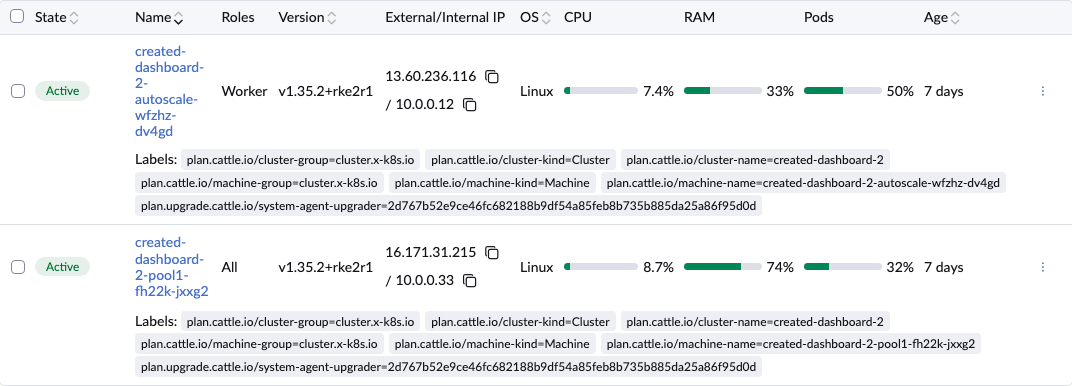
- All screenshots come from the master preview connected to the mf Rancher, on the cluster created-dashboard-2. It has two nodes:
pool1(all roles, 4 CPU, 7.63 GiB) andautoscale(worker, 2 CPU, 3.74 GiB). - On this cluster capacity equals allocatable, because nothing is reserved for the system, so with real data all three pages agree (screenshot 0). The differences only show up when nodes reserve resources, which is normal on EKS, AKS, GKE and Harvester.
- Scenarios 1–4 are simulated in the test browser only. The API responses and websocket updates are changed on their way into the page: each node reserves 1 GiB of memory and 0.1 CPU (allocatable = capacity − that), plus a cordon, removed worker labels, or a larger reservation where noted. Nothing was changed on the cluster. Within each scenario the node metrics are frozen at their first value, so every number on every page uses the same usage.
- Formulas are those on master (
775e0a11): node list =models/cluster/node.js, node detail =detail/node.vue, cluster dashboard =pages/c/_cluster/explorer/index.vue.
With no reserved resources, every page agrees


The same node shows a different memory % on the node list and the node detail page, and the cluster figure matches neither


| Where | Formula on master | Calculation | Shows |
|---|---|---|---|
| Node list, pool1 | usage ÷ capacity | 5.62 ÷ 7.63 GiB | 74% |
| Node detail, pool1 | usage ÷ allocatable | 5.62 ÷ 6.63 GiB | 85% |
| Cluster Dashboard | (usage − (capacity − allocatable)) ÷ allocatable | (6.86 − 2) ÷ 9.37 GiB | 51.87% |
| For comparison: sum of the node list | usage ÷ capacity | 6.86 ÷ 11.37 GiB | 60.4% |
The cluster totals leave out nodes that the node list still shows
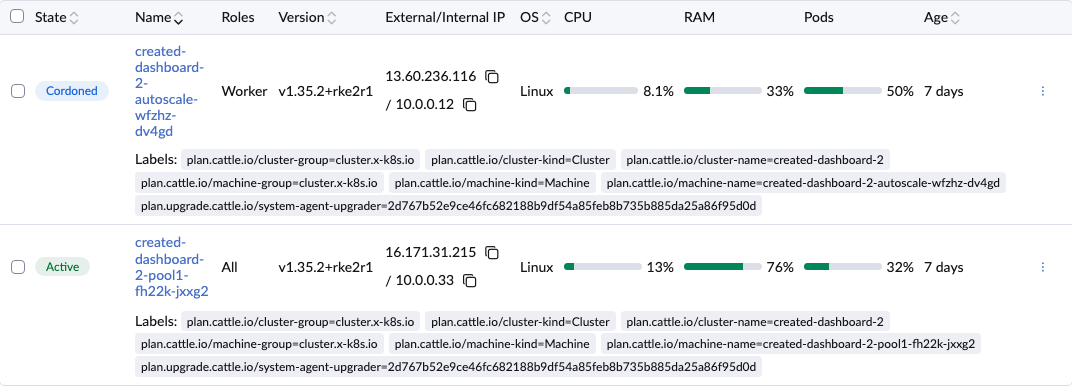

The same happens for any node without the worker role, such as a dedicated control-plane node. PR 18858 made this choice on purpose (count only where pods can be scheduled), but nothing on the page says so.
The same Cluster Dashboard shows different numbers depending on whether you opened the Nodes page first
This simulates an imported cluster whose Kubernetes nodes have no node-role.kubernetes.io/worker label (common for k3s, EKS, AKS and GKE nodes), with the same reservation as scenario 1. Rancher's own node records still mark them as workers.


- A: on a downstream cluster the dashboard doesn't load Rancher's node records, so it falls back to the Kubernetes label, finds no workers and takes the fallback path. That path divides the usage of every schedulable node by the cluster's allocatable, with nothing subtracted: 7.06 ÷ 9.37 GiB.
- B: the Nodes page loads Rancher's node records, and the dashboard's cleanup doesn't remove them because it targets the wrong store. Back on the dashboard, the nodes now count as workers and the worker path runs: (7.06 − 2) ÷ 9.37 GiB.
- Same cluster, same metrics, two different numbers. The fallback path is also the one that can go over 100% on managed providers, the case codyrancher raised in the 18858 review.
Used can go negative, and a negative value is drawn as a full bar

Usage was 0.51 cores against 0.8 reserved. The reservation is larger than a typical EKS node's, picked to make the effect visible. It happens whenever a cluster is quieter than its reservations, for example idle nodes on AKS or Harvester (harvester-118 reserves 1.06 of 24 cores).
- Fallback path, different node sets: usage is summed over every schedulable node, but Rancher's cluster allocatable leaves out tainted control-plane/etcd nodes that aren't workers. This is the issue 18751 bug, still present on the fallback path.
- Node list sorting: CPU and RAM columns sort by absolute usage but display a percentage, so with nodes of different sizes the order doesn't follow the numbers shown.
- Pods gauge: the worker path divides by pod capacity, the fallback path by allocatable pods (usually equal).